Overview
Watchman Tower monitors digital assets through a mix of scheduled checks, health signals, and connected integrations. The goal is not only to show whether something responded, but to give teams a clearer picture of asset health across websites, APIs, domains, SSL, and selected internal sources.The Monitoring Process
External Checks and Internal Signals
Watchman Tower works best when teams can combine different kinds of monitoring context:- External checks help confirm whether websites, APIs, SSL certificates, and domains are reachable and behaving as expected
- Internal signals can add extra context from integrations such as WordPress when you need visibility from inside the application
- Health evaluation helps turn individual results into a broader view of what matters operationally
What We Monitor
Website Availability
Check whether websites and endpoints are reachable and responding as
expected
Response Time
Track response speed and performance trends over time
SSL Certificates
Monitor certificate validity and expiration risk
Status Codes
Verify that monitored endpoints return the outcomes you expect
Domain Expiry
Track domain registration expiration dates
Server Health
Extend visibility into infrastructure health where server monitoring is in
use
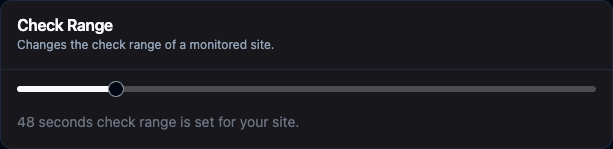
Check Intervals
Choose how frequently Watchman Tower checks your monitored assets:
| Interval | Best For | Checks Per Day |
|---|---|---|
| 30 seconds | Critical production services | 2,880 |
| 1 minute | Important websites and APIs | 1,440 |
| 5 minutes | Standard monitoring coverage | 288 |
| 15 minutes | Lower-priority assets and staging | 96 |
| 1 hour | Lower-frequency asset checks | 24 |
Shorter intervals detect issues faster but increase monitoring volume. Choose intervals based on operational urgency, expected traffic, and the role of each asset in your workflow.
Performance Metrics
Every check collects detailed timing information to help you understand your site’s performance: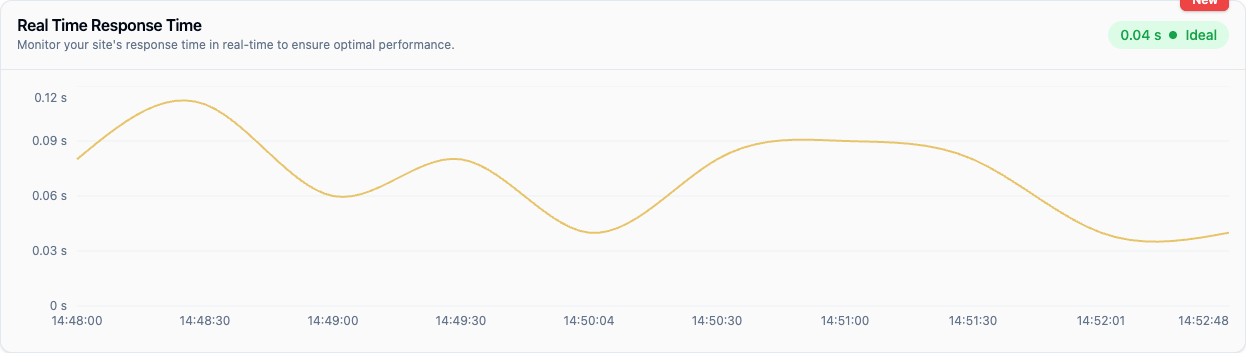

- Current Response Time: Live response time with status indicator (Ideal/Good/Slow)
- Response Time Trends: Historical performance over time
- Performance Patterns: Identify peak times and performance degradation
Status Types
Your monitors can show different statuses based on check results:🟢 Up
Everything is working perfectly - site is responding correctly
🔴 Down
Site is not responding or returning errors
🟡 Degraded
Site is responding but slower than expected or with issues
⏸️ Paused
Monitoring is temporarily disabled (maintenance mode)
Health Confirmation
Watchman Tower can use confirmation checks and repeated observations to reduce noisy incident decisions:
This approach helps reduce temporary network issues or short-lived glitches from becoming unnecessary incidents.
Data & History
Your monitoring data is stored and available for analysis:| Time Period | Data Available |
|---|---|
| Last 7 days | Full minute-by-minute details |
| Last 30 days | 5-minute aggregated data |
| Last 90 days | Hourly averages |
| Last year | Daily averages |
| All time | Monthly summaries |
All historical data is accessible through your dashboard with interactive graphs and downloadable reports.
Next Steps
Multi-Region Monitoring
Learn how active 3-region monitoring improves confidence and regional
visibility
Set Up Alerts
Configure notifications for when issues are detected
Quickstart Guide
Create your first monitor in 5 minutes
WordPress Integration
Add internal WordPress signals to your monitoring workflow