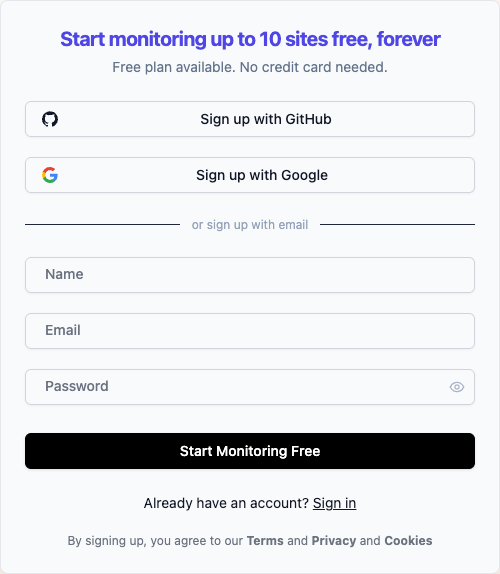
Create Your Account
- Visit app.watchmantower.com
- Sign up with email or OAuth (GitHub, Google)
- Verify your email address

Add Your First Monitor


Configure Basic Settings
Fill in your monitor details: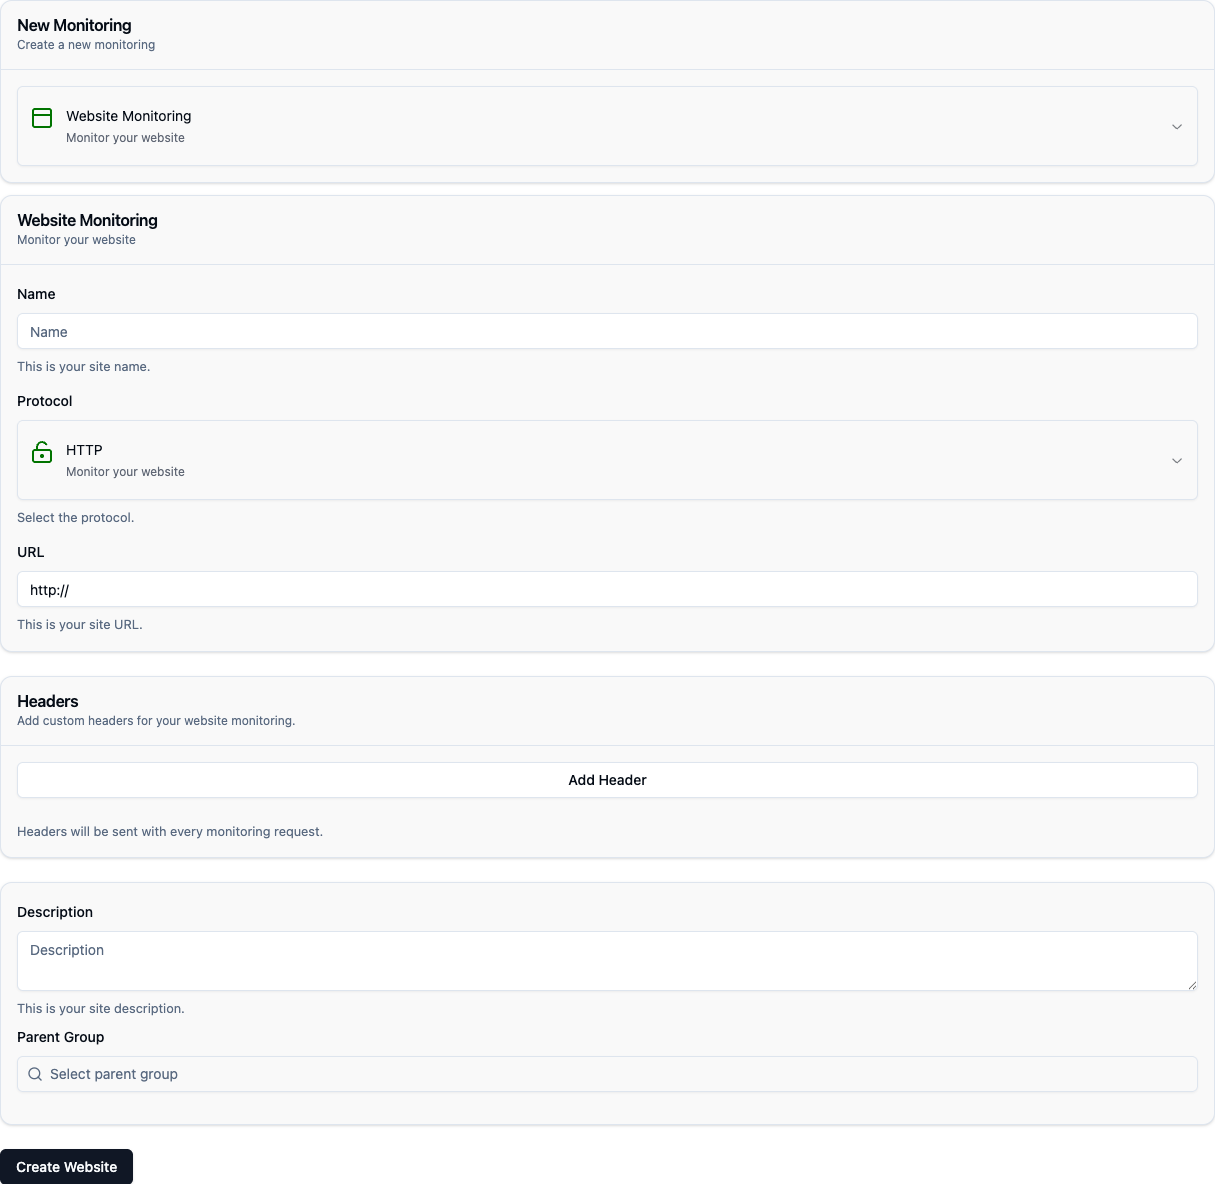

- Name: Friendly identifier (e.g., “My Website”)
- URL: Full URL including protocol (https://example.com)
- Method: HTTP method (GET, POST, HEAD)
- Interval: Check frequency based on how quickly you want health updates
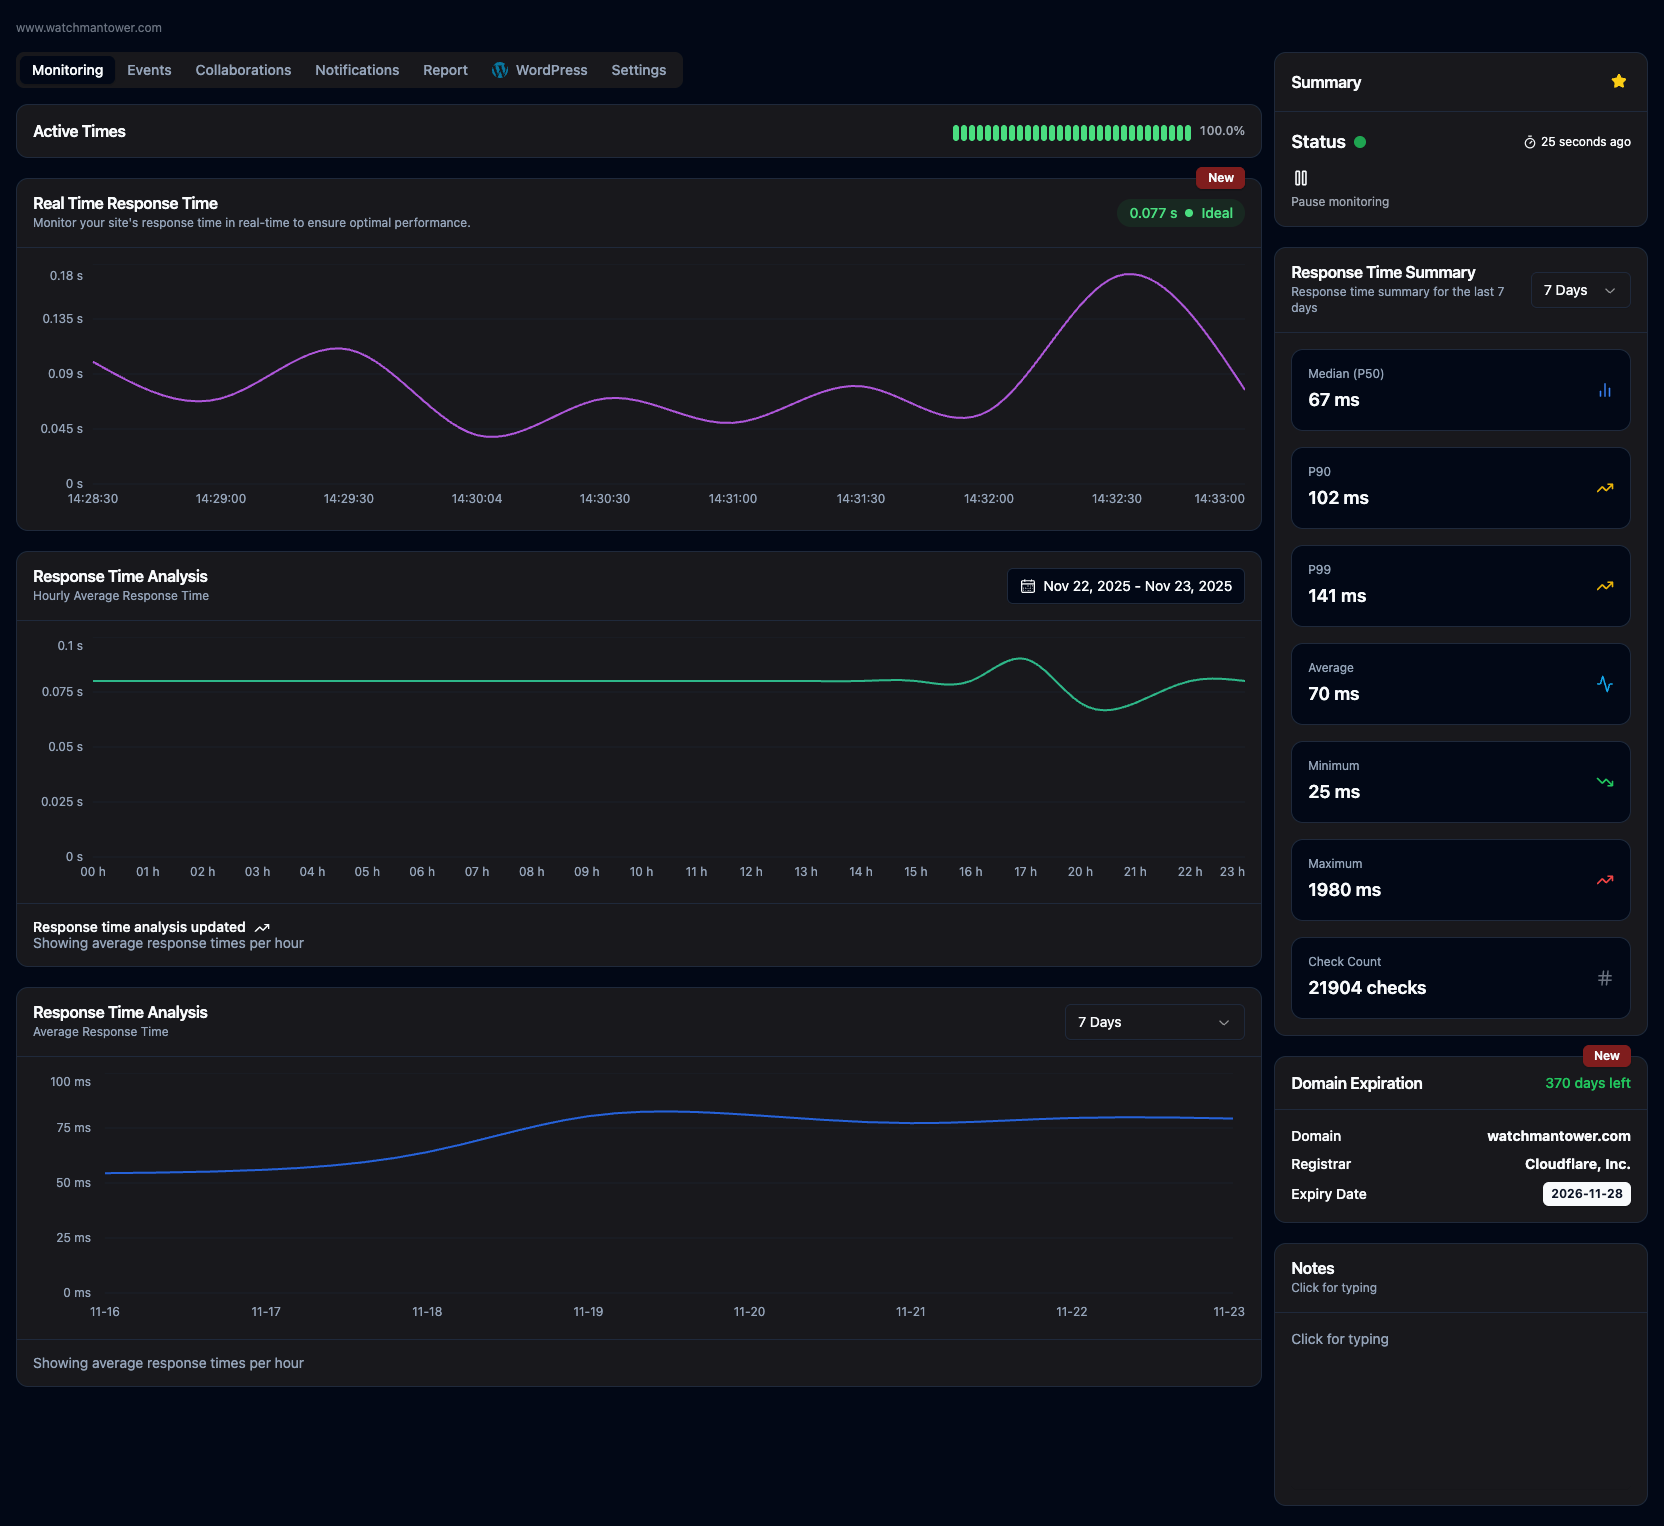
View Your Dashboard
Your dashboard shows:- Health Timeline: Recent status history with visual changes over time
- Response Time Graph: Ongoing response time tracking for monitored assets
- Response Time Analysis: Trend views that help spot degradation patterns
- Status Summary: Current state and key performance indicators
- Check Count: Total number of monitoring checks performed
- Domain and SSL Visibility: Expiration-related health context where available

Next Steps
Monitoring Overview
Learn how monitoring works behind the scenes
Alert Configuration
Advanced alert rules and escalation policies
WordPress Integration
Add internal WordPress signals when you need deeper visibility
API Reference
Integrate monitoring into your workflow
Common First Steps
Monitor multiple environments
Monitor multiple environments
Create separate monitors for staging, production, and development
environments with appropriate check intervals.
Set up team notifications
Set up team notifications
Create different alert channels for different teams (ops, dev, support)
based on severity.
Configure maintenance windows
Configure maintenance windows
Schedule maintenance windows to suppress alerts during planned downtime.
Add status page
Add status page
Create a status page to communicate service health with customers or
stakeholders.